The integration of Grafana with Zabbix occurs through the use of a plugin developed by Alexander Zobnin. Grafana-Zabbix is a plugin for Grafana allowing to visualize monitoring data from Zabbix and create dashboards for analyzing metrics and realtime monitoring. Main goals of this project are extend Zabbix capabilities for monitoring data visualization and provide quick and powerful way to create dashboards. It is possible due both Grafana and Grafana-Zabbix plugin features.
In this tutorial, we are going to show you how to integrate Grafana with Zabbix. If you didn’t yet installed Zabbix server or Grafana Check our previous tutorials:
- How To Install Zabbix 3.4 Monitoring Server On Ubuntu 16.04 LTS
- How To Install Zabbix 3.4 Server On CentOS 7 / RHEL 7
- How to Install Grafana using MySQL/MariaDB database on CentOS 7 / RHEL 7
Step 1./ Install zabbix plugin
– Connect to the Grafana Server, and to get a list of the available plugins use the grafana-cli command as shown below:
[root@ylclgrfas01 ~]# grafana-cli plugins list-remote | egrep "zabbix"
[root@ylclgrfas01 ~]# grafana-cli plugins list-remote
– To Install Zabbix plugin use the following command:
[root@ylclgrfas01 ~]# grafana-cli plugins install alexanderzobnin-zabbix-app
installing alexanderzobnin-zabbix-app @ 3.8.1
from url: https://grafana.com/api/plugins/alexanderzobnin-zabbix-app/versions/3.8.1/download
into: /var/lib/grafana/plugins

✔ Installed alexanderzobnin-zabbix-app successfully

Restart grafana after installing plugins .
– Restart Grafana after installing the Zabbix plugin as shown bellow:
[root@ylclgrfas01 ~]# systemctl restart grafana-server
service grafana-server restart
Step 2./ Enable Zabbix Plugin
Go to the plugins in Grafana side panel, select Apps tab, then select Zabbix, open Config tab and enable plugin
Step 3./ Configure Zabbix data source
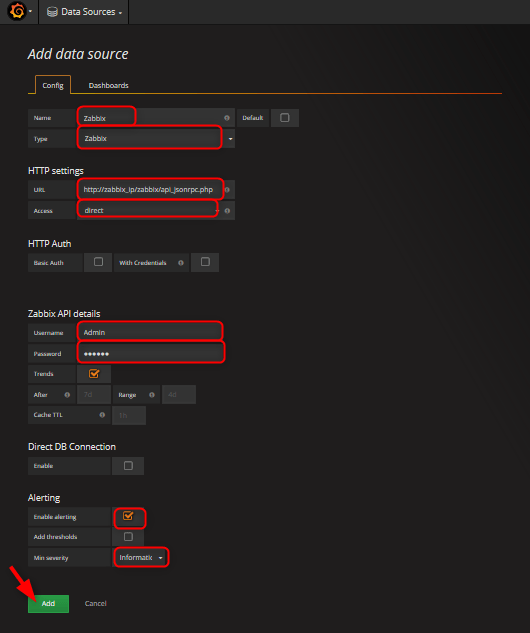
– After enabling plugin you can add Zabbix data source. Let’s add new Zabbix data source, open Data Sources in side panel, click Add data source .
– Give a name of the datasource and select Zabbix from dropdown list.
HTTP settings:
– URL : Set the Zabbix API url, it’s the full path of the zabbix frontend with api_jsonrpc.php in the end ( Example: http://IP_Zabbix/zabbix/api_jsonrpc.php).
– Access : Can be Proxy (access via Grafana backend) or Direct(access from browser).
Zabbix API details:
– User and Password: setup login for access to Zabbix API
– Trends: enable if you use Zabbix 3.x or patch for trends support in Zabbix 2.x (ZBXNEXT-1193). This option strictly recommended for displaying long time periods (more than few days, depending of your item’s updating interval in Zabbix) because few days of item history contains tons of points. Using trends will increase Grafana performance.
Direct DB Connection
Direct DB Connection allows plugin to use existing SQL data source for querying history data directly from Zabbix database. This way usually faster than pulling data from Zabbix API, especially on the wide time ranges, and reduces amount of data transfered.( In this tutorial we are not going to configure SQL data source in Grafana for zabbix)
– Enable: enable Direct DB Connection.
– SQL Data Source: Select SQL Data Source for Zabbix database.
Alerting
– Enable alerting: enable limited alerting support.
– Add thresholds: get thresholds info from zabbix triggers and add it to graphs.
– Min severity: minimum trigger severity for showing alert info (OK/Problem).
Finally click Add button – datasource will be added and you can check connection using Test Connection button. This feature can help to find some mistakes like invalid user name or password, wrong api url.
Step 4./ Import example dashboards
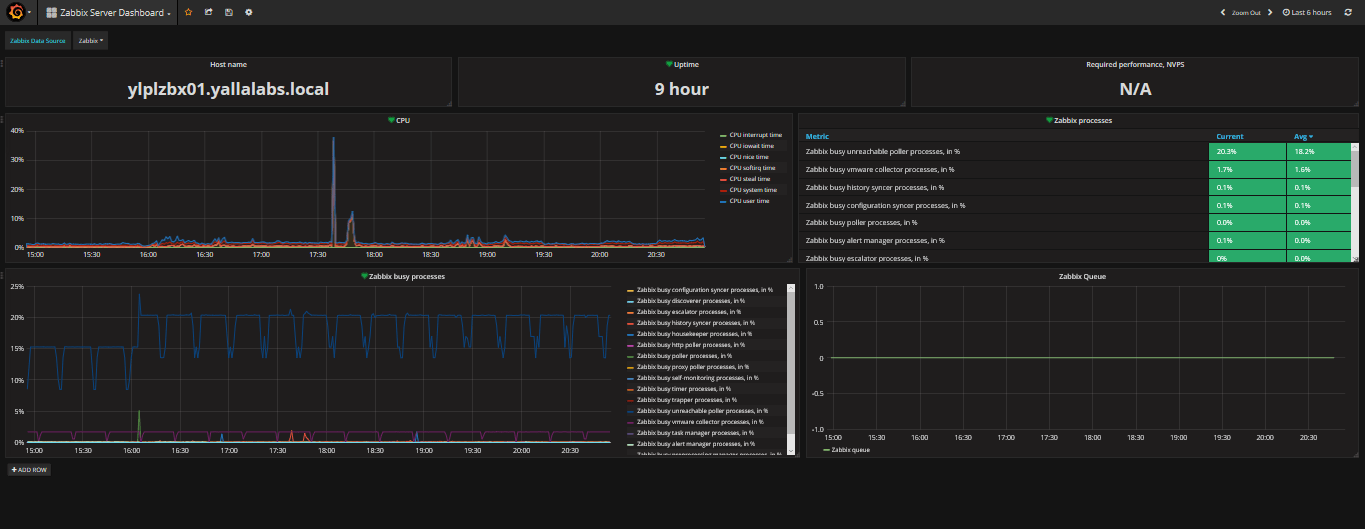
You can import dashboard examples from Dashboards tab in plugin config.or you can use the Zabbix dashboard that cames with the plugin. Select Zabbix server Dashboard from the dropdown list at the top of the screen. When you select it, the dashboard displays information about your Zabbix server.
We hope this tutorial was enough Helpful. If you need more information, or have any questions, just comment below and we will be glad to assist you!
PS. If you like this post please share it with your friends on the social networks using the buttons below.Thanks.


7 comments
I was able to add the zabbix server sucessfully, but in the dashboard does not show any information about the zabbix server. Do you know what it does not show anything?
Regards.
Hi Antonio,
Sorry for the late reply, by default zabbix plugin come with a Zabbix server Dashboard , From Dashboards tab select “Zabbix server Dashboard” .
Hi Antonio,
After done the stpes, adding the Data Sources > Save & Test, it shows an error “Could not connect to given url”. Please help to solve this.
Thanks in advance,
Hi,
the url should b the url of your zabbix server. By default it’s http://IP_Zabbix/zabbix/api_jsonrpc.php
Hi Lotfi
I have the same problem of NHA “Could not connect to given url”
I checked: 1) no network problem;
2) url used “http://ip_zabbix/zabbix/api_jsonrpc.php” and “http://ip_zabbix/api_jsonrpc.php”
3)With local credential i can connect on zabbix without problem.
4) Zabbix Plugin 3.10.5 to Zabbix version 2.4.7
I have you any idea where could be the problem?
Hi Jack,
From your grafana server check using curl from cli if you can reach the zabbix server Api
Hi,
When trying to add alert , we get “The datasource does not support alerting queries”
Does grafana support zabbix as a data source for Alerting ?