Grafana is an open source data visualization and monitoring suite. It offers support for Graphite, Elasticsearch, Prometheus, Zabbix and many more databases. Grafana allows you to query, visualize, alert on and understand your metrics with the ability to manage and create your own dashboard for your apps or infrastructure performance monitoring.
Grafana needs a database to store users, dashboards and session (and other things). By default it is configured to use sqlite3 which is an embedded database. In this tutorial, we will show you how to install and setup Grafana using MySQL/MariaDB database on CentOS 7 or RHEL 7.
Prerequisites
- RHEL7 or CentOS 7.
- Root privileges.
Step 1./ Install MariaDB/MySQL and Create Grafana Database
First of all, we need to install MariaDB/MySQL
[root@ylclgrfas01 ~]# yum install mariadb-server
– Use the following commands to enable and start MariaDB/MySQL at system boot
[root@ylclgrfas01 ~]# systemctl enable mariadb
Created symlink from /etc/systemd/system/multi-user.target.wants/mariadb.service to /usr/lib/systemd/system/mariadb.service.
[root@ylclgrfas01 ~]# systemctl start mariadb
– Don’t forget to set a password for the root using mysql_secure_installtion, take a look to this tutorial: Securing MySQL server / Mariadb with mysql_secure_installation
– Connect to the MariaDB/MySQL and create a Grafana Databse and
[root@ylclgrfas01 ~]# mysql -u root -p
Enter password:
Welcome to the MariaDB monitor.  Commands end with ; or \g.
Your MariaDB connection id is 25
Server version: 5.5.56-MariaDB MariaDB Server

Copyright (c) 2000, 2017, Oracle, MariaDB Corporation Ab and others.

Type 'help;' or '\h' for help. Type '\c' to clear the current input statement.
MariaDB [(none)]> create database grafana;
Query OK, 1 row affected (0.00 sec)

MariaDB [(none)]> grant all privileges on grafana.* to grafana@localhost identified by "Password";
Query OK, 0 rows affected (0.00 sec)

MariaDB [(none)]> flush privileges;
Query OK, 0 rows affected (0.00 sec)

MariaDB [(none)]> exit
Bye
Step 2./ Install Grafana
– Grafana provides two ways for installation, using the rpm package and using the yum repository. In this tutorial, we will install using rpm package installation. So let’s begin
# sudo yum install https://s3-us-west-2.amazonaws.com/grafana-releases/release/grafana-4.6.3-1.x86_64.rpm
– Backup the grafana.ini configuration file before starting using the following command:
[root@ylclgrfas01 ~]# cp /etc/grafana/grafana.ini{,.org}
– Edit the grafana.ini configuration file as below:
[root@ylclgrfas01 ~]# vi /etc/grafana/grafana.ini

#################################### Database ####################################
[database]
# You can configure the database connection by specifying type, host, name, user and password
# as seperate properties or as on string using the url propertie.

# Either "mysql", "postgres" or "sqlite3", it's your choice
type = mysql
host = 127.0.0.1:3306
name = grafana
user = grafana

# If the password contains # or ; you have to wrap it with trippel quotes. Ex """#password;"""
;password =

password = Password

#################################### Session ####################################
[session]
# Either "memory", "file", "redis", "mysql", "postgres", default is "file"

provider = mysql
# Provider config options
# memory: not have any config yet
# file: session dir path, is relative to grafana data_path
# redis: config like redis server e.g. `addr=127.0.0.1:6379,pool_size=100,db=grafana`
# mysql: go-sql-driver/mysql dsn config string, e.g. `user:password@tcp(127.0.0.1:3306)/database_name`
# postgres: user=a password=b host=localhost port=5432 dbname=c sslmode=disable
provider_config = `grafana:Password@tcp(127.0.0.1:3306)/grafana`

# Session cookie name
;cookie_name = grafana_sess

# If you use session in https only, default is false
;cookie_secure = false

# Session life time, default is 86400
;session_life_time = 86400
– After the installation, we need to Enable and start the Grafana at Boot System using the following command:
[root@ylclgrfas01 ~]# systemctl enable grafana-server
Created symlink from /etc/systemd/system/multi-user.target.wants/grafana-server.service to /usr/lib/systemd/system/grafana-server.service.
[root@ylclgrfas01 ~]# systemctl daemon-reload
[root@ylclgrfas01 ~]# systemctl start grafana-server
– By default, Grafana is running on port 3000. If you are using a firewall, open the port using the firewall-cmd command as shown below.
[root@ylclgrfas01 ~]# firewall-cmd --permanent --add-port=3000/tcp
success
[root@ylclgrfas01 ~]# firewall-cmd --reload
success
Step 3./ Access Grafana Frontend
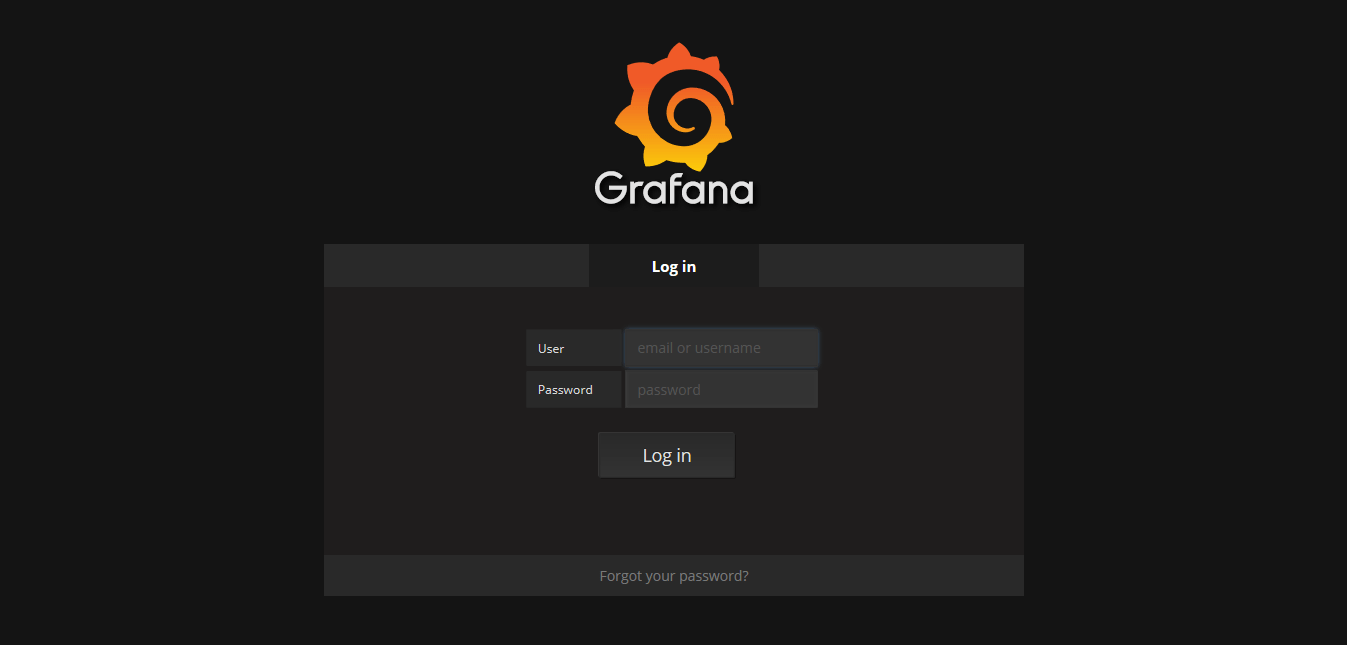
– After Grafana is successfully installed, open the web browser and type the grafana server IP address (with port 3000) http://grafana_ip_address:3000/. Log in to the Grafana Dashboard using default user “admin” and password “admin“.
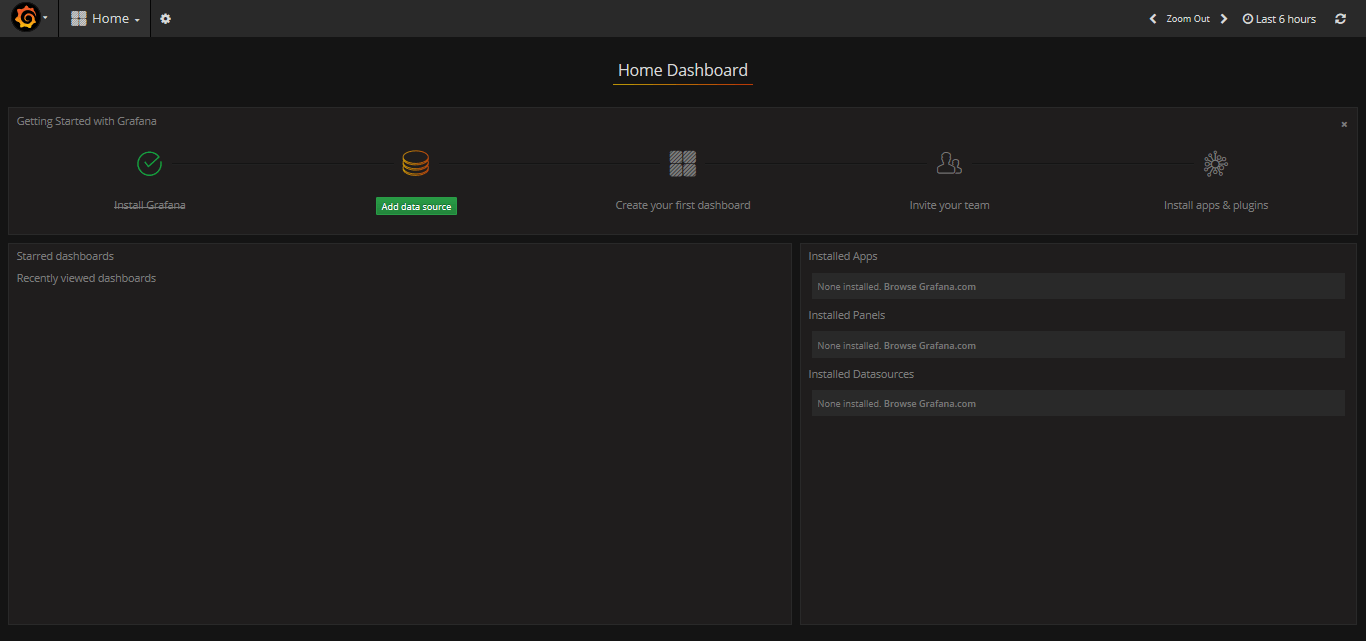
– You will see the Grafana Dashboard as shown below:
We hope this tutorial was enough Helpful. If you need more information, or have any questions, just comment below and we will be glad to assist you!
PS. If you like this post please share it with your friends on the social networks using the buttons below.Thanks.


